Query
Is investment in a state's anti-money laundering and anti-corruption framework self-sustaining?
Background
Corruption and money laundering have severe negative economic and financial implications at both a national and a global scale. Corruption hampers economic development and exacerbates inequality as resources are diverted away from public services (Transparency International n.d.). Money laundering is closely connected to corruption as it is used by corrupt actors to enjoy the proceeds of their crime through placing, layering and integrating stolen funds into the formal financial system. Both money laundering and corruption can cause volatility in international capital flows, undermine good governance, spark political instability and erode trust in governments and institutions (Claver, Khoury and Weeks-Brown 2023).
This Helpdesk Answer considers estimates on the extent to which anti-corruption and anti-money laundering (AML) initiatives reduce these negative financial and economic implications.5b94eb7b41cc While such initiatives can be costly to set up and operate (due to staff costs, office space, equipment and other operational expenditures), in the wider context of funds lost to corruption, their work intends to ultimately provide economic and financial benefits through the prevention and sanctioning of corruption, meaning stolen funds can be returned to the victim or used for the public good.
The economic theory behind the prevention and deterrence of corruption is based on the underlying assumption that corrupt actors conduct a cost-benefit analysis before deciding to engage in corrupt acts. Anti-corruption and anti-money laundering (AML) measures therefore aim to increase the costs of corruption through sanctions and the seizure of stolen assets. The benefits of implementing anti-corruption measures in this sense are therefore twofold: they reduce the incentives for corrupt actors to engage in corruption in the first place, and where this is proven to have occurred, identified stolen assets can be recovered.
However, not all the costs of corruption are monetary, as some forms of corruption such as rent seeking or patronage, have indirect consequences through the distortion of public policy and service delivery (Johnsøn 2014). Another example is the abuse of power for personal gain through supressing the rights of others, which does not have a direct financial impact but instead undermines public trust, human rights and rule of law. As such, even if these crimes are sanctioned, there may not be tangible financial assets that can be recovered.
A cost-benefit analysis includes measuring the benefits provided by an intervention, which can be monetary or non-monetary and then measures the monetary value of the benefits it produces (Johnsøn 2014). Little attention so far has been paid to the cost-benefit analysis of anti-corruption, which is in part due to the difficulty in measuring corruption (Johnsøn 2014), which will be discussed later in the paper. Another challenge to a cost-benefit analysis of corruption is that many of the anti-corruption interventions rely on mainstreaming rather than direct interventions (Johnsøn 2014). Nonetheless, estimating the costs and benefits of an intervention still provide useful policy guidance through evidence and can help to guide evaluations.
Counter measures to tackle anti-corruption and anti-money laundering (AML) initiatives have been implemented by almost every country worldwide. These are widespread and diverse, given that corruption covers a range of different illicit activities. These can be led by national governments, international organisations, civil society, private business and/or individuals. This Helpdesk Answer predominately addresses those led by national governments, but also considers that AML measures are largely implemented by financial sector actors.
Anti-corruption and AML initiatives that may be established by the state include:
- direct initiatives: national anti-corruption strategies, anti-corruption authorities, national legislation on corruption, financial intelligence units (FIU) and asset recovery agencies
- indirect initiatives: support for public financial management and procurement processes, mainstreaming integrity measures into the delivery of public services, activities to promote transparency, training programmes on ethics and awareness raising campaigns among public officials (Johnsøn 2014)
On the other side, the financial returns from anti-corruption and AML interventions encompass direct and indirect gains. They largely fall under direct gains (primarily financial) and indirect gains (primarily economic) which include:
- direct gains: the recovery of stolen assets such as monetary assets and/or property and other items of value or the avoidance of corruption induced cost increases to public services and projects
- indirect gains: increased business confidence, allowing businesses to thrive without money lost to bribery (for example), enhanced international cooperation through AML efforts which results in a more secure global financial system and reputation preservation of a country which leads to higher foreign direct investment (FDI) and better international relations
In summary, this Helpdesk Answer focuses on direct anti-corruption interventions that are implemented by the state, such as the formation of anti-corruption agencies, national crime agencies tasked with investigating corruption cases or the establishment of financial intelligence units (FIU). These are responsible (to varying levels) for pursuing anti-corruption cases and are paid for by the state budget. In terms of financial and economic returns, this paper will focus on both direct and indirect gains that are achieved by these agencies. Finally, it then considers the question posed in some of the literature on how to use recovered assets and whether the state agencies responsible for anti-corruption and AML can (and should) be financed by returned assets.
The economic and financial costs of corruption
Many institutions and experts have attempted to quantify the global economic and financial cost of corruption, often as an advocacy tool and to spur on political will to address corruption. As an example of a global figure, the OECD estimates that around 2.5% of the world’s gross domestic product (GDP) is lost annually to corruption, which is equivalent to the size of the French economy (OECD 2017). Another estimate is provided by the World Economic Forum stating that US$2 trillion is lost globally every year to corruption (Thomson 2017). In addition, the UNODC estimates the amount of money laundered globally in one year is between 2% to 5% of global GDP, or US$800 billion to US$2 trillion (UNODC n.d.). However, it should be noted that these sources make it clear that these are estimates and the margin of error may be large.
On a global scale, it is clear that there is a correlation between corruption and the overall gross domestic product of a country. Kuipers (2021) shows the positive correlation between GDP and lower levels of corruption, as measured by the Corruption Perceptions Index, and is a relationship that is relatively consistent worldwide:
Figure 1
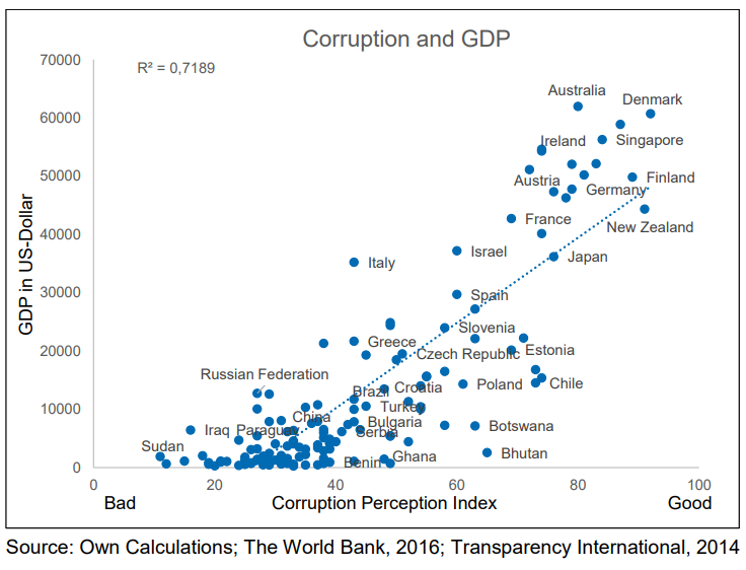
Kuipers 2021.
However, Kupers (2021) warns that this positive correlation does not necessarily pinpoint specific causalities. The impact of corruption on economic growth is contextual and cannot be generalised (Kupiers 2021). For example, government institutions with high levels of bribery, clientelism and election fraud did not inhibit economic growth in the USA or Argentina in the 19th century (Kuipers 2021).
Another recent attempt to quantify the financial impact of corruption includes Artificial Fiscal Intelligence’s (AFI) index which attempts to measure the costs of inefficiency and systemic corruption in countries across the world using a risk-based approach to calculate losses through public finance systems. Their data from 2018 shows that Australia lost 4.14% of its GDP, the UK 6.45% of GDP, Thailand 5.57%, Morocco 8.76% and Mozambique 9.41% to inefficiency and corruption (AFI 2023). Their estimates are determined through expert interviews and other subjective assessments, through which they extrapolate quantitative estimates. However, it is unclear how reliable these are given the huge gaps on public financial management data in many countries, making it questionable whether this is more reliable than a straightforward risk assessment of corruption in public financial management.
Corruption has been shown to reduce total investment, both public and private (Farinha and López-de Foronda 2023). Private investors take into account that they have to bribe officials to get the permits and licences for their projects, which increases the cost of projects; therefore, bribery deters potential private investors (Enste and Heldman 2017). In lower income countries in particular, bribery is estimated to account for 10% of the total cost of doing business (UNPRI 2016). It introduces distortions and the composition of public spending (Mauro 1998), therefore reducing the effectiveness of government actions. All of these reduce overall economic growth (Farinha and López-de Foronda 2023).
An analysis of 180 countries shows that corrupt countries also collect fewer taxes, as people may pay bribes to avoid these and make use of tax loopholes in exchange to kickbacks (Gaspar, Mauro and Medas 2019). When taxpayers believe their governments are corrupt, they are also more likely to evade paying taxes (Gaspar, Mauro and Medas 2019). In Georgia, reduced corruption led to more than doubling of the amount of tax collected between 2003 and 2008 and a GDP rise of 12 percentage points (Gaspar, Mauro and Medas 2019).
In developing countries, the outflows of illicit financial flows tend to greatly exceed the inflows of aid and net foreign direct investment (FDI) (Reed and Fontana 2011); in sub-Saharan Africa, between 1980 and 2009, US$1.2 to 1.3 trillion left the continent. However, this is not just a problem that affects lower income countries; in 2023, the European Commission (EC) estimates that the EU economy loses around €120 billion per year to corruption (EC 2023).
Problems with quantifying the economic and financial costs of corruption
While these global figures on the cost of corruption may attract much attention, many caution that “there are no credible estimates of the global cost of corruption” (Hartmann and Ferreyra 2022). Research broadly provides evidence that corruption is associated with a range of negative outcomes and does indeed hamper sustainable development but attempts to quantify costs are problematic (Hartmann and Ferreyra 2022).
As mentioned earlier, not only is it difficult to demonstrate causality between economic growth/decline and levels of corruption, there are issues with measuring corruption itself (see Kenny 2022) as well as global discrepancies in how accessible the necessary data is. Regarding money laundering, despite the UNODC’s attempts to quantify losses at a global level, they go on to emphasise that this is “merely an estimate due to the clandestine nature of money laundering” (UNODC n.d.).
When it comes to these quantitative estimates on the scale, cost or incidence of corruption, it is worth differentiating between the “big global claims” intended to demonstrate corruption is a problem worth our attention and the more localised and targeted evidence-based figures, which seek to generate more reliable estimates of corruption in a given sector, country or process. This has led to a trend in recent years to focus on producing more localised estimates, based on the premise that a “few well-chosen proxy indicators can be more informative than a sea of data or dozens of aggregate cross-country indices” (Johnson 2013: 2). As a rule, the more granular and context specific the parameters for the estimate, the more reliable these figures are likely to be.
Triangulating different data sources, particularly household surveys, administrative data and socio-economic statistics, can help to demonstrate the cost of corruption in different sectors and for different demographic segments. The first step here would be to identify geographies, institutions or sectors of particular interest to policymakers, then commission researchers to map available datasets and draw inferences and conclusions on the relationship between corruption and other variables of interest, be that infant mortality or access to justice.
For example, in countries like the UK, it is estimated that £1.27 billion is lost annually to fraud, bribery and corruption in its national health service (NHS) (NHS Counter Fraud Authority 2020). Another instance of quantifying the costs of corruption in a specific sector is the corruption cost tracker developed by Basdevant and Fazekas (2023). This assesses corruption risks in public procurement through aggregating the frequency of observation of seven red flags with corruption.f8e82079a44d In For instance, in Georgia, it was found that, around 15% of spending across sectors was lost to corruption (Basdevant and Fazekas 2023). Finally, the costs of corruption are more easily depicted in individual corruption cases, such as the case of Bahrom Haydarov, the previous Andijan major in Uzbekistan, who allegedly embezzled around US$4.3 million from public funds during his tenure (EurasiaNet 2022).
The costs of investing in anti-corruption and anti-money laundering initiatives
The United Nations Conventions against Corruption (UNCAC) mandates that signatory states endeavour to ensure public services are safeguarded against corruption, criminalise and investigate cases, and establish a regime that enables AML and asset recovery (STAR n.d.c). The UNODC provides a legislative guide for the UNCAC which sets out the necessary components of an anti-corruption and AML regime. Notable direct measures that would have a financial cost for the state include (some are optional and some mandatory as per the UNCAC):
- an anti-corruption body or bodies in charge of preventive anti-corruption measures and policies
- the establishment of appropriate systems of procurement based on transparency, competition and objective criteria in decision-making
- the justice sector (prosecutors, judiciary, etc.) which is responsible for countering transnational crime and corruption and preventing opportunities for corruption among members of the judiciary
- the establishment of financial intelligence units (FIU) and a specialised body or bodies to counter corruption through law enforcement
- the designation of a central authority responsible for receiving requests for mutual legal assistance (UNODC 2006)
- other agencies may include an ombudsman and an auditor general’s office
However, it should be noted that these initiatives do not exist in a vacuum but rely on an enabling framework such as a well-functioning justice system for anti-corruption and AML reforms to be effective. Moreover, quantifying the costs for each country to implement and sustain such measures varies widely as the costs of anti-corruption interventions differ across different geographic contexts (Johnsøn 2014). Nonetheless, to give an idea of the costs involved, below are several operating budgets of agencies responsible for anti-corruption and AML:
Table 1: the operating budgets of different government agencies responsible for anti-corruption and AML
|
Government agency |
The agency’s mandate |
Operating budget |
|
US Department of Treasury Financial Crimes Enforcement Network in 2023 |
Works on tackling money laundering and terrorism, safeguarding the financial system and promoting national security. |
US$222 million in 2023 (Home Treasury 2023) |
|
UK National Crime Agency (NCA) and National Economic Crime Centre (NECC). |
Leads on the UK’s fight to cut serious and organised crime such as fraud, drug trafficking, money laundering and illicit finance, bribery, corruption and sanctions evasion. The NECC sits within the NCA and specifically focuses on economic crime. |
£872 million in 2023/24 (roughly US$1.1 billion) (Home Office 2023 a). The expenditure for the National Economic Crime Centre (within the NCA) in 2020/2021 was £35.5 million (roughly US$45 million) (They Work for You 2021). |
|
UK Serious Fraud Office (SFO) |
A specialist prosecuting authority tackling top level serious or complex fraud, bribery and corruption. It investigates cases as well as prosecutes. |
£71,754,000 (roughly US$91 million) in the year 2022 to 2023 (SFO 2023: 79) |
|
Canadian Anti-Money Laundering and Anti-Terrorist Financing (AML/ATF) Regime |
A wide number of government agencies fall under the regime, notably include Canadian Security Intelligence Service (CSIS), Financial Transactions and Reports Analysis Centre of Canda (FINTRAC) and the Office of the Superintendent of Financial Institutions (OSFI). |
the Canadian government has made investments of $319.9 million, with $48.8 million (roughly US$36 million) ongoing (Government of Canada 2023) |
|
Comptroller General of Brazil |
A branch of the federal government responsible public audits, anti-fraud, corruption prevention and ombudsman activities |
R$1,292 million (roughly US$261,207) (Ministry of Planning and Budget 2023) |
As illustrated in Table 1 above, national governments need to commit to a significant investment of resources (and time) to ensure corruption is detected, and that the proceeds of corruption can be tracked and recovered (Nizzero 2023). However, data shows that, despite these costs, states are increasingly dedicating funds to the operation of anti-corruption and AML agencies. By 2020, 114 countries were recorded as having one or more dedicated anti-corruption agency (UNDP 2022). A 2021 survey conducted by STAR on asset recovery trends showed that, across its 59 member states, 75% had been involved in at least one asset recovery case pertaining to the proceeds of corruption, indicating that at least 75% have set up a dedicated agency tasked with asset recovery (STAR cited in Nizzero 2023).
Funding anti-corruption and AML agencies
The IMF provides guidance on financing a typical financial intelligence unit (FIU), an agency funded by state authorities or ministries responsible for implementing the AML/CFT laws and setting up systems for detecting and reporting suspicious transactions (IMF 2004). The IMF notes that “an FIU needs resources commensurate with its size and the amount of data it is expected to receive, process, and disseminate” (IMF 2004). Other factors also need to be taken into account in determining its resource needs, such as its location (whether it sits in a ministry or government agency) (IMF 2004).
Regarding anti-corruption agencies, the Colombo Commentary on the Jakarta statement on principles for anti-corruption agencies provides states with guidelines to fulfil their obligations under the UNCAC on effective anti-corruption bodies. On the budget of anti-corruption agencies, the UNODC recommends that:
“In general, research into anti-corruption agency budgets in relation to national population sizes suggests that spending at least $1 per capita on an [anti-corruption agency] may be sufficient to contribute substantially to addressing corruption” (UNODC 2020: 57).
The commentary also notes that insufficient funding is a clear inhibitor of success for an agency (UNODC 2020:57). For example, in Bangladesh, a decline in funding for the national anti-corruption commission was reported throughout the years 2010, 2011 and 2012 (Ankamah and Manzoor 2018). In 2012, the budget was €3.46 million for an agency tasked with investigating and exposing corruption in a country with over 150 million people (Ankamah and Manzoor 2018). As such, insufficient staffing numbers led to a reported reduction in agency efficiency (Ankamah and Manzoor 2018).
In terms of AML, the majority of the burden of costs falls on the financial services industry and designated non-financial services (sometimes referred to as gatekeepers) (EC 2024) rather than state budgets. For example, the FATF Recommendations set out essential measures for countries to implement, which include the development of relevant policies, identification and prosecution of AML, and enhancing the beneficial ownership information of legal persons and arrangements (FATF 2012). Many of the preventive measures (customer due diligence, record-keeping, enhanced due diligence measures for high-risk countries and reporting of suspicious transactions) are the responsibility of the financial services sector (FATF 2012).
Some argue that the cost of AML for the financial services sector is not cost effective (Saperstein, Sant and Ng 2015). They contend that the fight against financial crimes has “swallowed up the core business of banking, such as providing loans and banking services” (Saperstein, Sant and Ng 2015: 5). Nonetheless, other studies, such as by Pol (2020) estimate that AML requirements help authorities intercept about US$3 billion of an estimated US$3 trillion in illicit funds generated annually (0.1% success rate) and costs banks and other businesses more than US$300 billion in compliance costs, more than a hundred times the amounts recovered from criminals. (Pol 2020).
While the majority of AML costs falls on the financial services sector, there are elements which should be provided by the state. Identifying clients and verifying their identity is a necessary component of AML, and if there is no national identification system (particularly one that lacks integrity) it will inhibit institutions’ ability to implement AML measures (Bester et al. 2008). Furthermore, the onus is on the government to ensure that financial regulatory/supervisory, law enforcement and intelligence agencies have the capacity to enforce AML controls on financial institutions (Bester et al. 2008).
Evidence on the return on investment of anti-corruption and anti-money laundering
The recovery of stolen assets
One of the most direct means of measuring the return on investment of anti-corruption and AML is through asset recovery. Asset recovery intends to deprive corrupt actors of their assets, whereby national authorities trace, seize and confiscate stolen funds and assets and return them to their country of origin (FATF n.d.). In addition to returning funds, the threat of asset recovery acts as a deterrent to corrupt actors, through increasing the risks and costs of corruption (Basel Institute on Governance 2020). It also aims to enhance the rule of law and trust in government (Basel Institute on Governance 2020).
Given that many corruption cases are transnational, asset recovery often means that different countries need to collaborate to trace the assets and return them to the jurisdiction from which they were stolen (FATF n.d.). While states typically lead the asset recovery process, civil society organisations (CSOs) have also played an important role through awareness raising, research and advocacy.
The UK provides statistics on returned assets in granular detail, and the US provides a certain level of detail (Oldfield 2024). However, on the whole, most countries do not report on the amounts of assets returned. As such, this section relies heavily on the data provided by the UK and US.
Since 2010, the Stolen Asset Recovery Initiative (STAR) by the World Bank and UNODC measures that the value of assets stemming from corruption that have been returned internationally is worth US$10.1 billion since STAR reporting began (STAR n.d. a). In terms of national-level statistics, greater transparency around the value of assets returned to the state and victims through the work of responsible national agencies would assist in a cost-benefit analysis of such efforts. However, unlike the figures reported by STAR, the stated amounts of returned assets are usually not disaggregated by crime type (nor is funding for asset recovery). This means estimating the exact amount of assets stolen through corruption is difficult.
In 2022, of the US$7.7bn in assets subject to FinCEN asset seizures, US$225m was permanently forfeited to the government under the Bank Secrecy Act (as a reminder, its operating budget for was US$222 million). Notably, 25.7% of its investigations were on public corruption in 2022. However, forfeited asset totals are not disaggregated by crime.
In the UK, there are three distinct legal mechanisms used to recover assets related to criminal activities. Civil recovery orders are used to recover assets that are deemed to be the proceeds of crime; confiscation orders are issued as part of the sentencing process after conviction and require the defendant to pay a specified sum after their assets have been assessed; and forfeiture orders involve the confiscation of specified assets deemed to be used in connection with criminal activity (such as money and cars).
The National Crime Agency (NCA) reported its success in denying criminal assets over the three years between 2018 and 2021 to be £646.5 million (its operating budget in 2020/2021 was £35.5 million) (NCA 2021). The UK recovers funds through the Proceeds of Crime Act (POCA) 2002, which provides the statutory framework to enable the investigation and prosecution of crimes relating to benefit from criminal conduct and is used to deprive criminals of their money or other property connected to criminal activity (Home Office 2023 b). In the single year 2022-2023, the UK recovered assets totalling £339.1 million (Home Office 2023 b). Figure 2 below shows the totals recovered between 2017 and 2023:
Figure 2
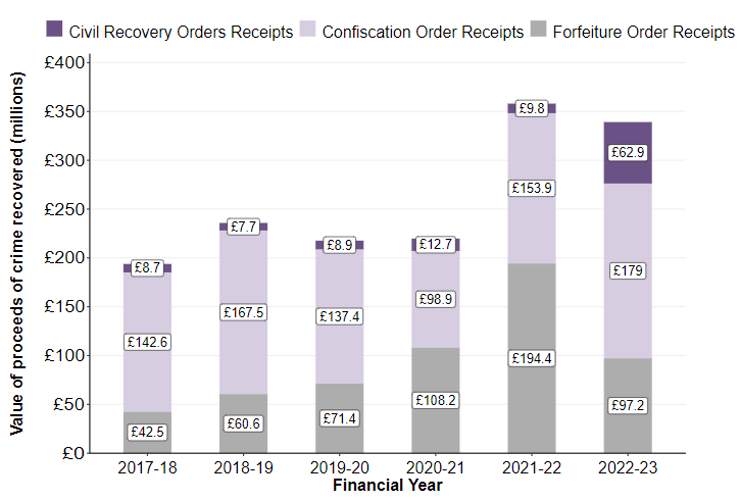
Home Office 2023.
In the year 2022/2023, the Serious Fraud Office produced a £93.5 million confiscation order for a corruption case involving bribery across a company’s oil operations (Home Office 2023 b). The Home Office attempts to disaggregate the total value of frozen and seized assets through grand corruption (however, it notes that these statistics are experimental with data quality issues):
- £275,015 of proceeds of crime restrained, seized or frozen
- £95,397 total value of proceeds of crime recovered
- £210,610 total proceeds of crime returned to foreign government (Home Office 2023 b)
Forsaith et al. (2012) measured the profitability of asset confiscation work in EU member states, looking at the ratio of annual ongoing profit (amount confiscated) to annual ongoing cost of asset confiscation work. The results show that all EU member states are estimated to be profitable, and only six (Luxembourg, Sweden, Austria, Ireland, Finland and Denmark) were not (see pages 91 to 92 in Forsaith et al. 2012). Some results include:
- Czech Republic: €36 million cost; €131 million revenue; and €94 million profit.
- Poland: €4 million cost; €19 revenue; and €15 million profit.
- Netherlands: €8 million cost; €13 million revenue; and €5 million profit (Forsaith et al. 2012)
However, the report notes that, despite these calculations, profitability is difficult to predict due to the complexity of asset confiscation systems which have outcomes that are impossible to predict with certainty (Forsaith et al. 2012: 89). The above figures are rough estimates which indicate that asset confiscation is likely to be profitable if pursued fully but are not wholly complete or accurate (Forsaith et al. 2012).
As a final example, the IMF reported that between 2010 and 2015 assets forfeited in Canada totalled roughly US$433,042,075 (IMF 2016). While this figure is not recent, it still gives an idea of the high amount of assets that are frozen and recovered by the relevant Canadian agencies.
Wider economic benefits
Anti-corruption and AML interventions have been shown to have positive wider economic impacts as well as direct financial returns through asset recovery. The Sustainable Development Goals (SDGs) note that curbing corruption is necessary to achieve sustainable development (UNDP n.d.). Increasing anti-corruption measures would help ensure that development financing is safeguarded and would maximise the impact and success of development projects (UNDP n.d.).
Stronger regulation that reduces corruption and opportunities for bribery enables businesses to compete on fairer terms. After the implementation of the Foreign Corrupt Practices Act (FCPA), US firms experienced a 6.4% increase in revenues over those that were found in violation of the act (Goldman and Zeume 2021). Another study in Singapore found that anti-corruption policies resulted in better firm performance, with an estimated 12.8% improvement in net profit margins and 11.7% in asset growth.
The implementation of anti-corruption and AML measures also increases confidence in inbound investment. There are a number of international agreements and conventions which mandate a minimum standard for anti-corruption and anti-money laundering. For example, the IMF looked at the impact of grey listing by the Financial Action Task Force (FATF) on capital flows using machine learning. This analysis showed that grey listing correlates with a loss of capital inflows of around 7.6% of its GDP, through a reduction in foreign direct investment and portfolio inflows (Kida and Paetzold 2021). Therefore, avoiding the FATF grey list (and its subsequent reputational damage), is desirable for attracting foreign investment. Moreover, a statistically significant positive relationship between foreign direct investment (FDI) and the Corruption Perceptions Index (CPI) has been found by some analysts (Karadima 2021).
Finally, building up cooperation between states on asset recovery has the indirect (and direct) effect of building a stronger global economy. Corruption is often transnational in its nature and requires states to cooperate in investigating cases and returning assets. Asset recovery requires formal cooperation through mutual legal assistance (MLA) or mutual administrative assistance (MAA). FIUs regularly cooperate through the Egmont Group, where information is shared through law enforcement networks and help an investigative team build a more complete picture of a case (Nainappan n.d.).
The redistribution of recovered assets
There are many potential purposes for recovered assets, which depend on the nature of the crime, whether a victim or country of origin can be identified and the relevant state legislation. The UNCAC sets out a framework for the return and management of stolen assets (STAR n.d. b). After law enforcement officers or other agencies collect evidence and trace assets, following the correct legal avenues on how to proceed with the case (i.e. criminal or civil actions or both), assets should be returned to either the general treasury or to a confiscation fund, and then finally to asset management where they may be returned to a requesting jurisdiction, victim or to a domestic fund (STAR n.d. b). Typically, it is the ministries of justice and/or foreign affairs that decide the end use of returned funds, particularly when assets are returned across borders (De Simone, Pereira & Zinkernagel 2014).
In many jurisdictions both state and non-state victims can make compensation claims (Dell 2023). It is common in jurisdictions, such as in the European Union, to use confiscation mechanisms to provide restitution to victims of crime generally, and priority is often given to victims over state victims (Dell 2023). In the EU, if funds are to be deposited to a general treasury or national budget there should be a national law that stipulates to which budgets these funds will ultimately end up (Greenberg et al. 2009).
Many countries choose to establish an asset forfeiture fund to manage the returned assets and determine how and to whom they might go. The FATF sets out in its interpretive notes for Recommendation 38 that “countries should consider…establishing an asset forfeiture fund in its respective country into which all or a portion of confiscated property will be deposited for law enforcement, health, education, or other appropriate purposes” (FATF 2012). An asset forfeiture fund may provide a source of revenue for the agencies responsible for asset recovery. For example, countries such as Canada, Chile, Israel, Switzerland and the US all have asset forfeiture funds (Greenberg et al. 2009).
Returned assets and the use of asset forfeiture funds is recommended by the FATF to transparently fund projects that further public good (FATF 2012: 7). This is referred to as social reuse (Dell 2023). As an example of social reuse, returned assets can be used for development objectives if a victim cannot be identified. France, for example, has a model of restitution of illicit assets directly back to the national treasury of countries of origin, or otherwise to the French Development Agency, NGOs or to international organisations such as the World Bank (Brimbeuf 2021). Donor agencies can play a facilitating role in ensuring adequate policy coherence between the asset repatriation effort and the development policy and priorities of both the requesting and requested states (De Simone, Pereira & Zinkernagel 2014). Donor agencies often are acquainted with the long-term development priorities and needs of countries and can therefore act as an important adviser to agencies from their own jurisdictions in identifying suitable end-use programmes (De Simone, Pereira & Zinkernagel 2014).
Donor agencies might also contribute to the management of returned assets; however, it should be noted that this should not replace previously budgeted donor programmes and instead should be seen to add value in addition to normal donor funded programmes (De Simone, Pereira & Zinkernagel 2014).
Another option is that, given the role that civil society organisations (CSOs) have in the asset recovery process, some CSOs may be recipients of returned assets themselves (International Centre for Asset Recovery et al. 2013). In addition, Article 35 of the UNCAC offers the potential for compensation damage as an avenue for CSOs if they have initiated legal action on corruption related offences (International Centre for Asset Recovery et al. 2013).
The UK combines victim compensation and government agency funding. In 2022 to 2023, £15.5 million was paid in compensation to victims from the proceeds of crime through confiscation order receipts and £117.9 million was transferred to the asset recovery incentivisation scheme (ARIS) (Home Office 2023 b). ARIS allows a proportion of the proceeds of crime recovered under POCA to be redistributed to operational partners in the asset recovery process (Home Office 2023 b). Figure 3 below shows how ARIS funds have been distributed between the years of 2017 to 2022:
Figure 3
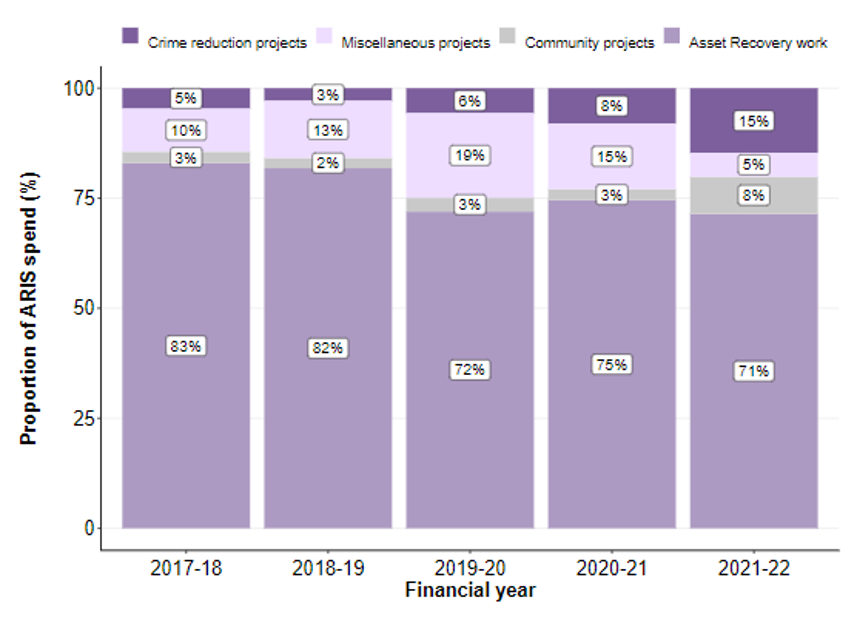
Home Office 2023.
Between 2022 and 2023, £2.6 million of ARIS funds went to the Joint Asset Recovery Database, which is operated by the NCA, £800,000 to the Regional Asset Recovery Team Lawyers and £750,000 to the cybercrime programme Cryptocurrency Capability (Home Office 2023 b).
In the US, the Comprehensive Crime Control Act of 1984 established the Department of Justice Assets Forfeiture Fund to receive returned assets (US Department of Justice n.d.). Under equitable sharing payments, funds can be claimed by agencies to reflect the degree of direct participation in law enforcement efforts resulting in forfeiture (US Department of Justice n.d.). The asset forfeiture fund is also used to compensate victims for their losses related to the crime that gave rise to the forfeiture (Stanek 2016). In 2023, US$1,597,812,000 was paid to law enforcement from the asset forfeiture fund (Department of Justice 2023).
Its 2023 annual report provides the case of Danske Bank where, in December 2022, the US Department of Justice charged Danske Bank A/S of operating a long-running scheme to commit bank fraud. The bank allegedly conspired with others to offer banking services with no oversight to high-risk customers, resulting in the laundering of large sums of criminal or other suspicious proceeds through the US financial system. As a result, Danske Bank agreed to a criminal forfeiture of US$2.059 billion which was returned to the asset forfeiture fund (Department of Justice 2023: 10).
In Australia, returned assets can be forfeited to agencies such as the director of public prosecutions and the police (Armstrong Legal n.d.). In Luxembourg, the asset forfeiture fund is used by state agencies to promote the development, coordination and implementation of means to curb certain forms of crime, including the confiscation of drugs, money laundering or the financing of terrorism (Ministry of Finance 2024). In its annual reports (published up until 2018), the projects funded are made publicly available; for example, many funded projects focus on anti-drug campaigns or counter-narcotics equipment for the police (Fonds de Luttre Contre Certaines Formes de Criminalité 2018).
Potential problems regarding the use of returned assets
The funding of anti-corruption and AML agencies (and others such as law enforcement agencies) through returned assets has raised some concerns among experts. One concern is that revenues from asset seizures are unlikely to be stable or predictable over time, leaving programmes starved of resources if they rely heavily on the funding (Greenberg et al. 2009). Indeed, it is recommended in the Colombo Commentary that:
“The resources of the ACA [anti-corruption agency] should also derive from a regular budget rather than ad hoc contributions provided under an executive decree or donor funding. Ideally, the ACA should have a separate budget line in the national budget that is passed through the legislature for review and endorsement” (UNODC 2020: 58).
Donor agencies have a role to play in ensuring that the return of stolen assets does not undermine regular state budget planning (De Simone, Pereira & Zinkernagel 2014). This was a criticism in the case of returned assets from Switzerland to Nigeria. The Nigerian government had expected returned funds from Switzerland to increase budget spending in support of the Millenium Development Goals (STAR 2009). These assets were expected to be received in 2004 and were therefore included in the 2004 budget. However, because of delays in the transfer of funds, the incremental budget increase was finally financed through the creation of new debt (STAR 2009). Therefore, the enabling legislation for a forfeiture fund should state that forfeited assets are to be used to supplement appropriated funds, not replace them (STAR 2009).
In addition, the use of returned assets to fund government agencies responsible for asset recovery may generate perverse incentives that distort law enforcement priorities and encourage the pursuit of cases that maximise revenues, rather than those which pose a threat to society (Greenberg et al. 2009). Holcomb et al. (2011) studied whether asset forfeiture laws that create financial incentives would inappropriately influence police behaviour. The study reveals that three key aspects of state forfeiture laws – allocation of proceeds to law enforcement, the burden of proof on innocent owners and the required standard of proof – significantly influence whether state and local law enforcement agencies opt to participate in federal equitable sharing programmes (Holcomb et al. 2011). Therefore, enforcement agencies consider the legal burdens and financial rewards of their own state law compared to those under “federal equitable sharing” arrangements in determining how to process asset seizures. This calls into the question the appropriate role and limits of asset forfeiture by law enforcement (Holcomb et al. 2011).
Conclusion
The review of the literature in this Helpdesk Answer finds that there could be (estimated) net positive financial gain to investing in anti-corruption and AML. However, as operating budgets and returned assets are not disaggregated by type of crime or publicly available it is difficult to determine the precise cost-benefit analysis of investigating and prosecuting corruption cases. There are insufficient data points to conclusively state that there is a positive financial return in investing in an anti-corruption and AML regime.
Given the difficulties in estimating the wider cost of corruption and costs of direct anti-corruption measures, a cost-benefit analysis may be more useful in a targeted, sectoral context, such as evaluating the impact of anti-corruption interventions in a specific business sector which is significantly affected by bribery.
The use of returned assets is also a contentious issue in the literature. While some countries do fund their anti-corruption and AML agencies partially through returned assets, this should not be the basis of their funding due to the inconsistent nature of asset recovery and the perverse incentives it may generate. As best practice, the proceeds of corruption should be returned to the victim, and where that is not possible (or relevant), returned to the state budget.
- Finance concerns money, banking and other aspects of the financial system. Economics involves the wider economy and how resources are allocated and distributed. While they are closely related, it is important to note that these are two separate concepts.
- The red flags for corruption in procurement contracts can be found on page 3 of the report.